How Robo Advisors Explain Risk
28th June, 2020
One of the key value propositions of digital wealth managers, or robo-advisors, is that they help clients understand risk associated with the portfolios, instead of focusing only on the returns.
However, risk is usually not as well understood by the average investor as expected returns.
This is because an individual’s risk tolerance is driven not only by past performance and rational expectations, but also by unique personal circumstances and other emotional factors such as hopes and fears.
Also, an individual’s risk tolerance is hardly a static measure.
Most individuals would decidedly perceive their risk tolerance to be lower in 2020, due to uncertainties presented by Covid-19, than at any time during the past decade. The desirability of a recommended portfolio is assessed by an investor partly by her perception of the portfolio’s riskiness.
This is why it is vital for a robo-advisor to clearly illustrate risk, so that investors can understand the riskiness and relate it to their own tolerance, goals, and emotional preferences.
How to calculate quantitative risk for your personal portfolio.
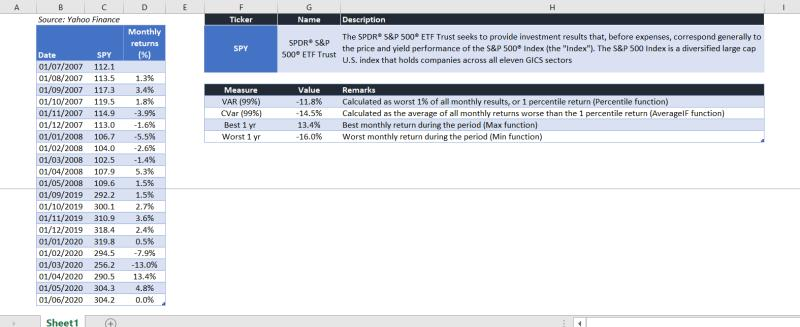
The image below shows an illustration of how Var, CVar, and best/worst returns are calculated for a single asset portfolio on excel. The asset taken into consideration is SPY, which is an ETF that tracks large-cap US stocks.

Data used for the above calculations pertain to NAV and monthly returns from July 2007 till June 2020. The calculations can be performed using excel functions.
It is important to note that these measures may yield different values, depending on the calculation methodology and period of observation. Choice of methodology and period should be based on factors such as availability of data, expected investment time horizon, and personal judgement.


